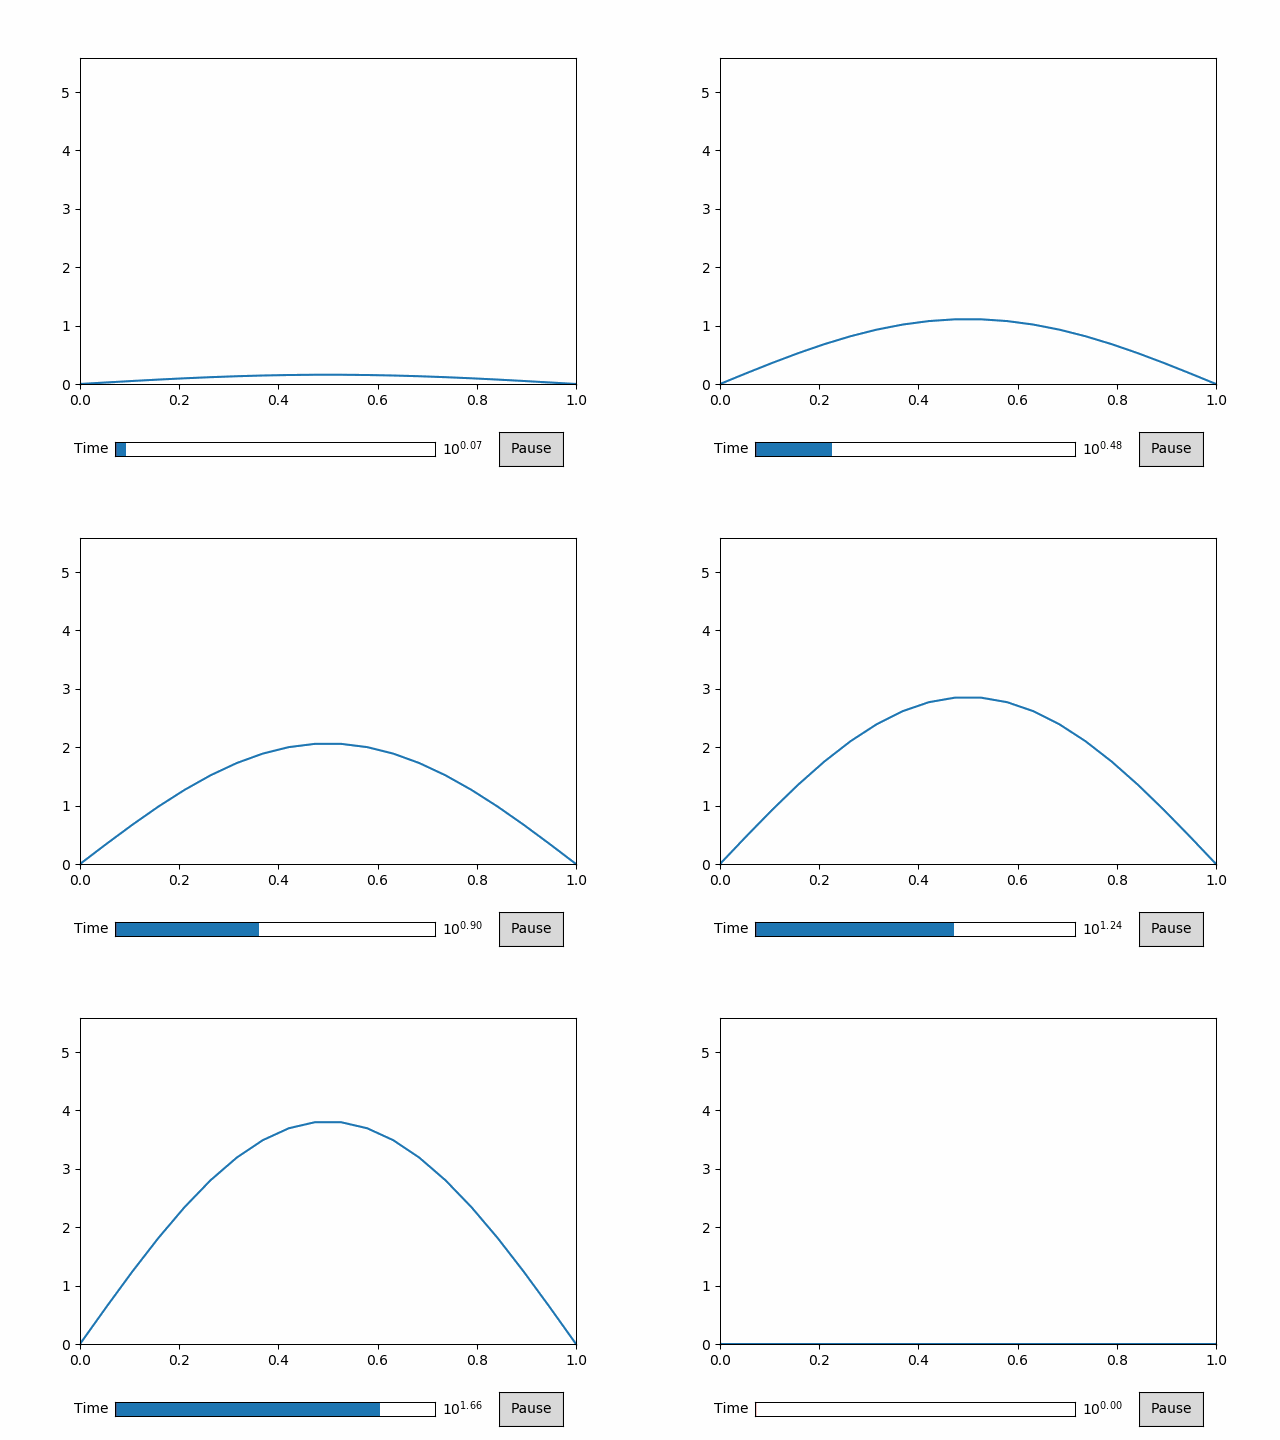
Logarithmic Timescales
Simply pass the keyword argument log=True to the Timeline, to get
logarithmic timescales.
In [1]:
import numpy as np
import matplotlib.pyplot as plt
import animatplot as amp


x = np.linspace(0, 1, 20)
t = np.logspace(0, 2, 30)

X, T = np.meshgrid(x, t)
Y = np.sin(X*np.pi)*np.log(T)

timeline = amp.Timeline(t, log=True)
block = amp.blocks.Line(X, Y)
anim = amp.Animation([block], timeline)

plt.xlim([0,1])
plt.ylim([0,Y.max()+1])

anim.controls()
anim.save_gif('logtime')
plt.show()
<Figure size 640x480 with 3 Axes>
