Polarization
In [1]:
%matplotlib notebook
import numpy as np
import matplotlib.pyplot as plt
import animatplot as amp
Let’s create the data.
In [2]:
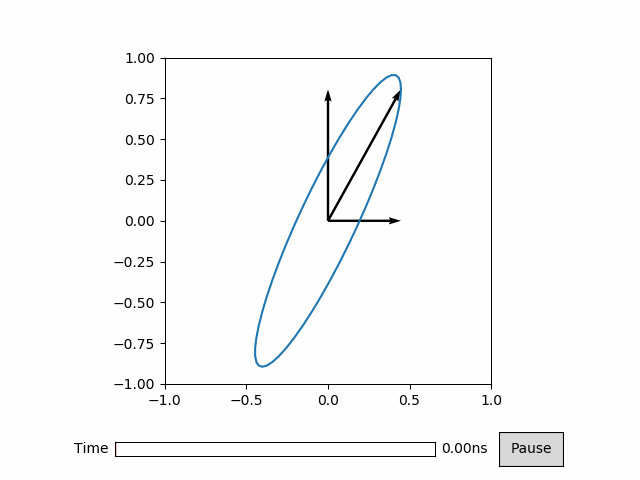
E0 = np.array([1, 2])
E0 = E0 / np.linalg.norm(E0)

phi = np.array([0, np.pi/7])

f = 3
t = np.linspace(0,2*np.pi,50)

# The Electric Field
E = E0[:, np.newaxis]*np.exp(1j*(t+phi[:, np.newaxis])) # fancy array boardcasting

# Converting the Electric field into animatable arrows.
X = np.zeros(3) # x location of the arrow tails
Y = np.zeros(3) # y location of the arrow tails

zeros = np.zeros_like(E[0,:]) # padding
U = np.array([E[0,:], zeros, E[0,:]]).real
V = np.array([zeros, E[1,:], E[1,:]]).real
Now to animate it.
In [3]:
plt.plot(E[0].real, E.real[1])

timeline = amp.Timeline(t, units='ns', fps=20)
block = amp.blocks.Quiver(X, Y, U, V, t_axis=1, scale_units='xy', scale=1)
anim = amp.Animation([block], timeline)

block.ax.set_aspect('equal')
block.ax.set_xlim([-1,1])
block.ax.set_ylim([-1,1])

anim.controls()
anim.save_gif('polarization')
plt.show()