Getting Started
Animatplot is built on the concept of blocks. We’ll start by animating a Line block.
First we need some imports.
Note
Interactivity is not available in the static docs. Run the code locally to get interactivity.
Basic Animation
[1]:
%matplotlib notebook
import numpy as np
import matplotlib.pyplot as plt
import animatplot as amp
We will animate the function:
\(y = \sin(2\pi(x+t))\) over the range \(x=[0,1]\), and \(t=[0,1]\)
Let’s generate the data:
[2]:
x = np.linspace(0, 1, 50)
t = np.linspace(0, 1, 20)

X, T = np.meshgrid(x, t)
Y = np.sin(2*np.pi*(X+T))
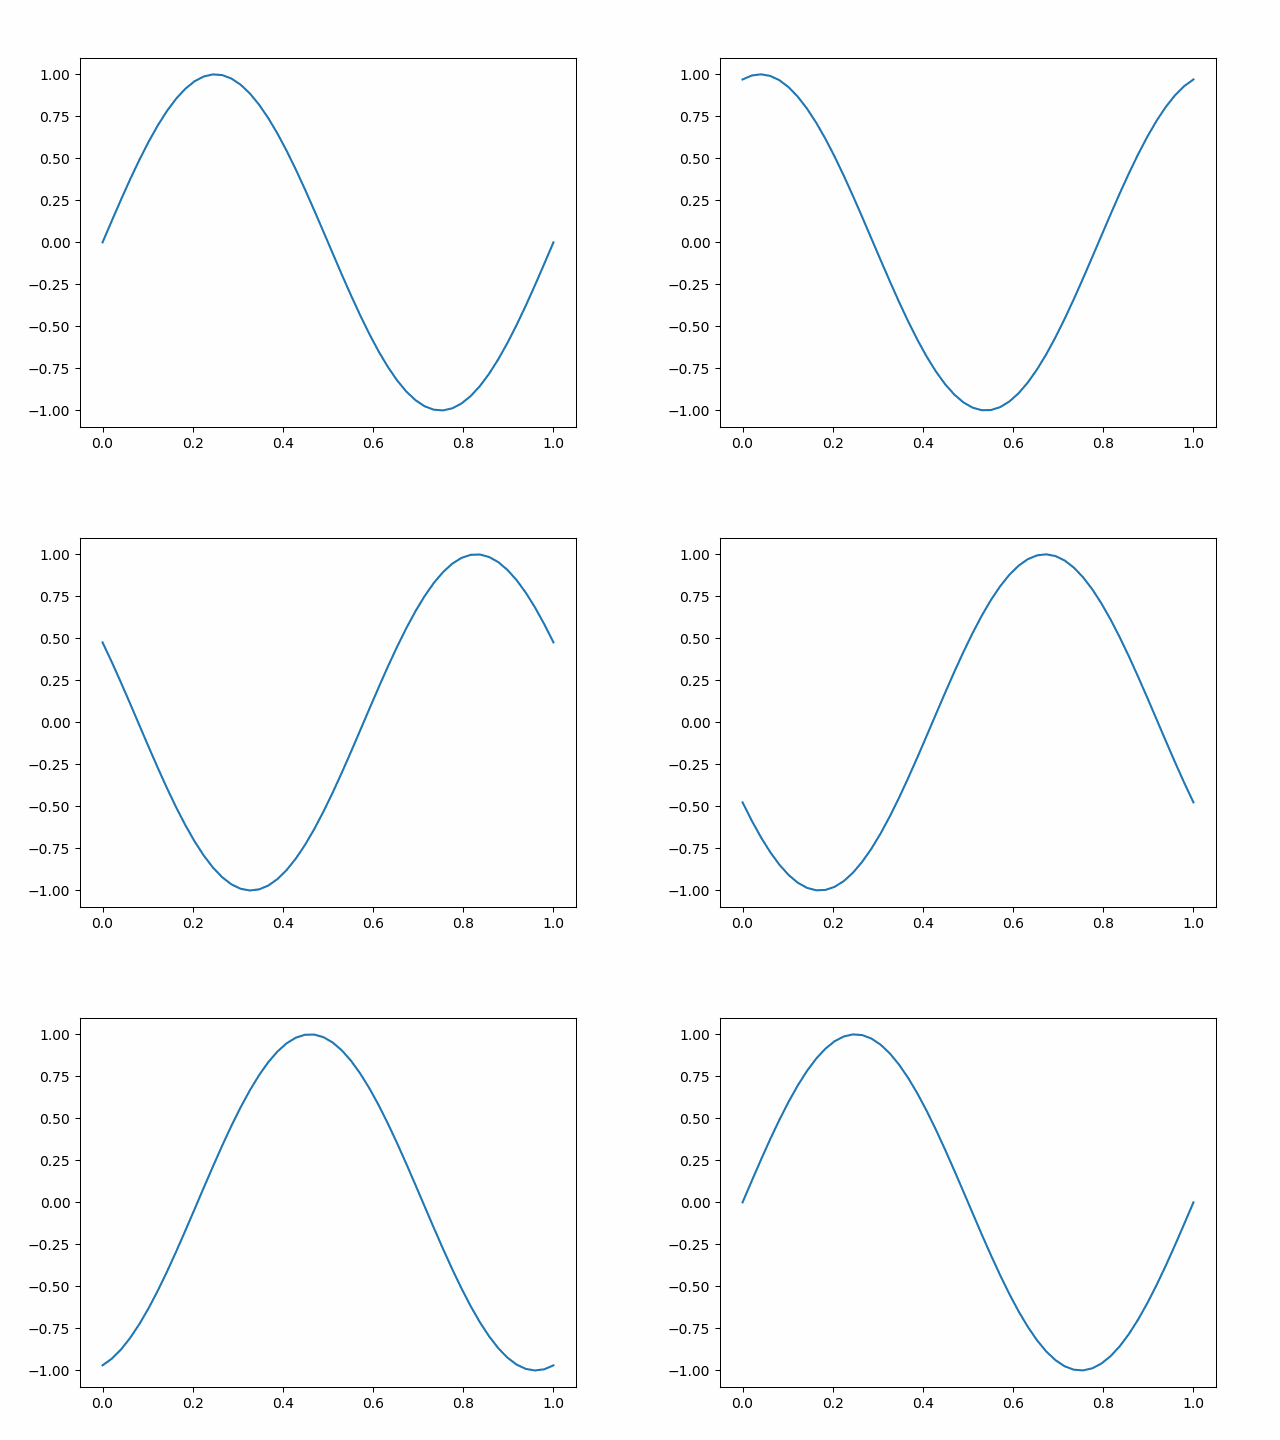
In order to tell animatplot how to animate the data, we must pass it into a block. By default, the Line block will consider each of the rows in a 2D array to be a line at a different point in time.
We then pass a list of all our blocks into an Animation, and show the animation.
[3]:
block = amp.blocks.Line(X, Y)
anim = amp.Animation([block])

anim.save_gif('images/line1') # save animation for docs
plt.show()
Adding Interactivity
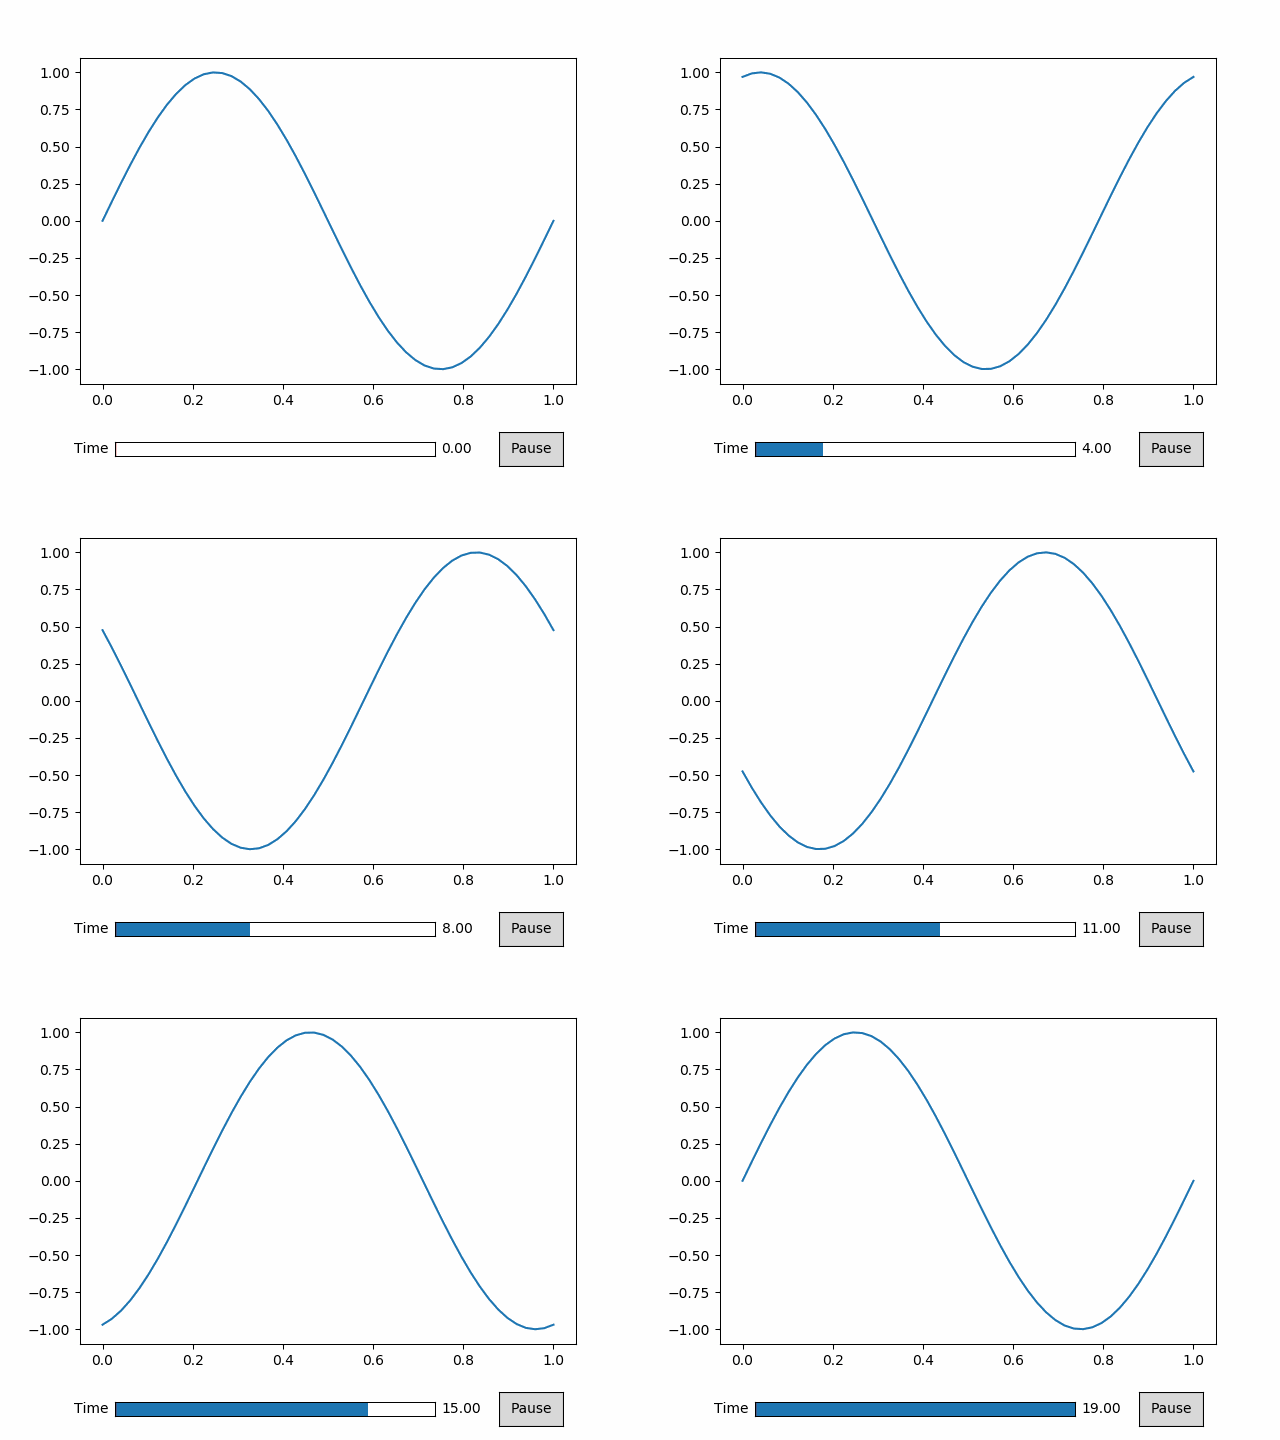
We’ll use the same data to make a new animation with interactive controls.
[4]:
block = amp.blocks.Line(X, Y)
anim = amp.Animation([block])

anim.controls() # creates a timeline_slider and a play/pause toggle
anim.save_gif('images/line2') # save animation for docs
plt.show()
Displaying the Time
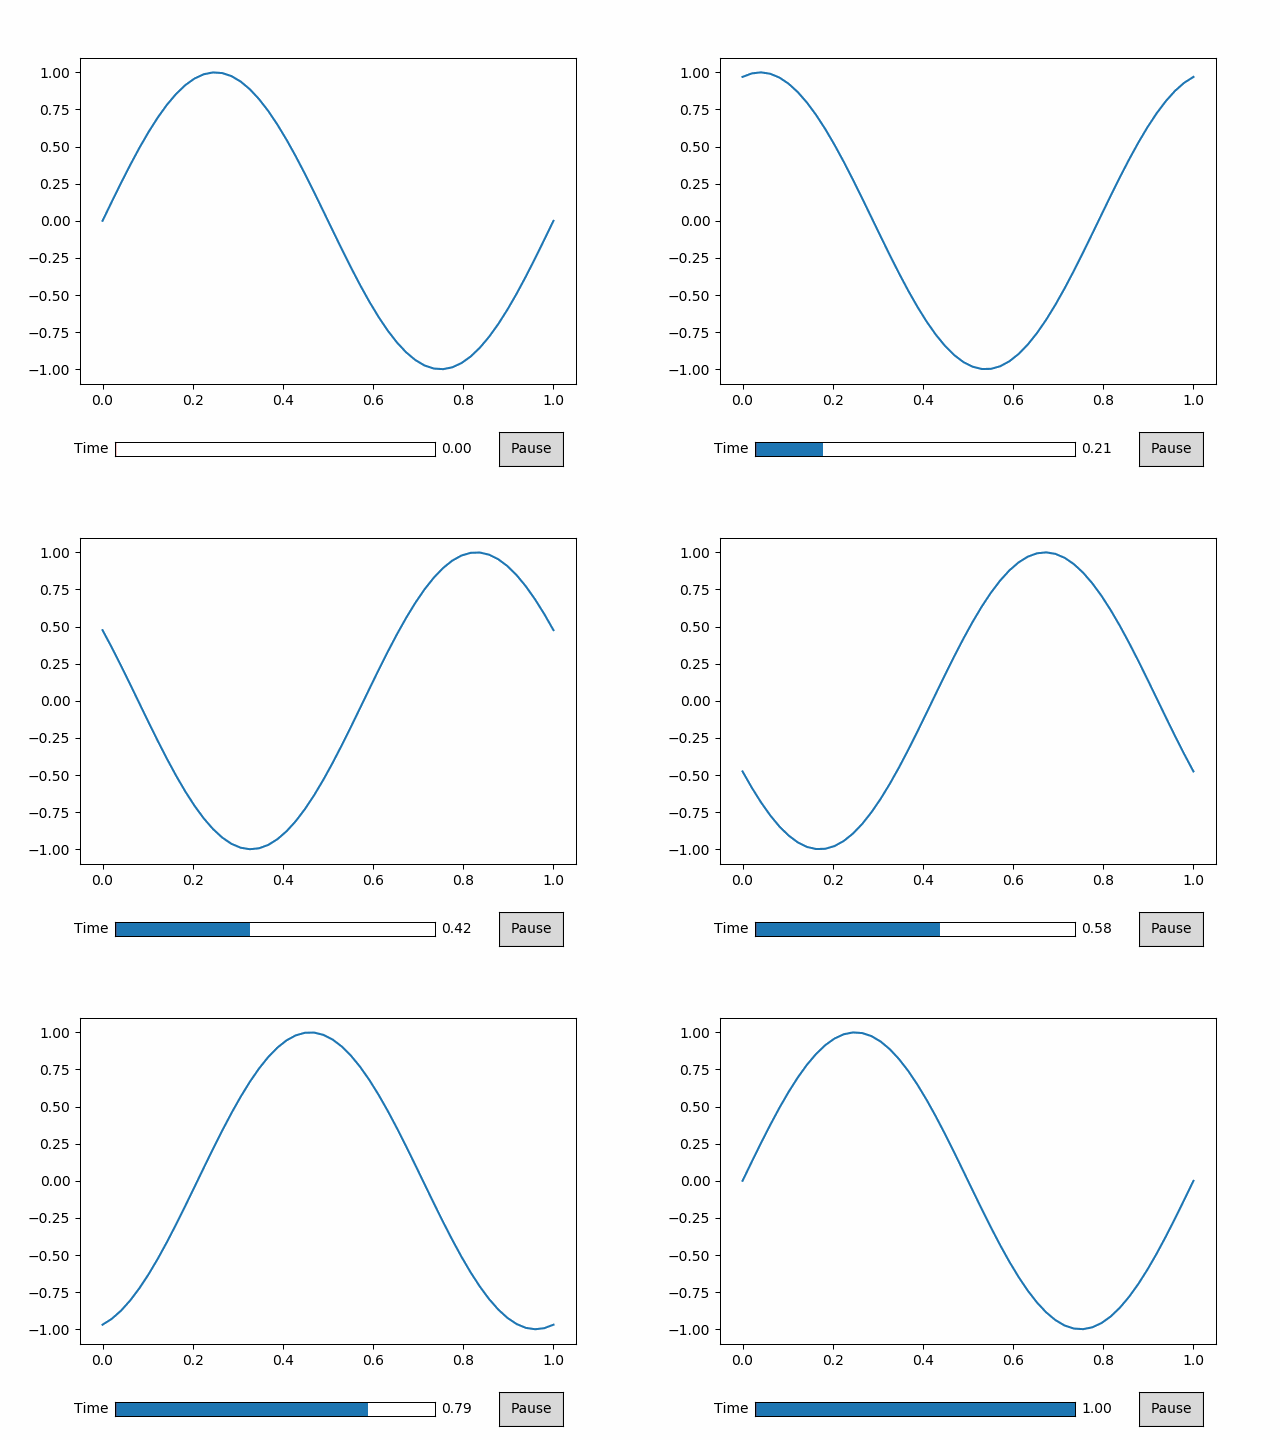
The above animation didn’t display the time properly because we didn’t tell animatplot what the values of time are. Instead it displayed the frame number. We can simply pass our values of time into our call to Animation.
[5]:
block = amp.blocks.Line(X, Y)
anim = amp.Animation([block], t) # pass in the time values

anim.controls()
anim.save_gif('images/line3') # save animation for docs
plt.show()
Controlling Time
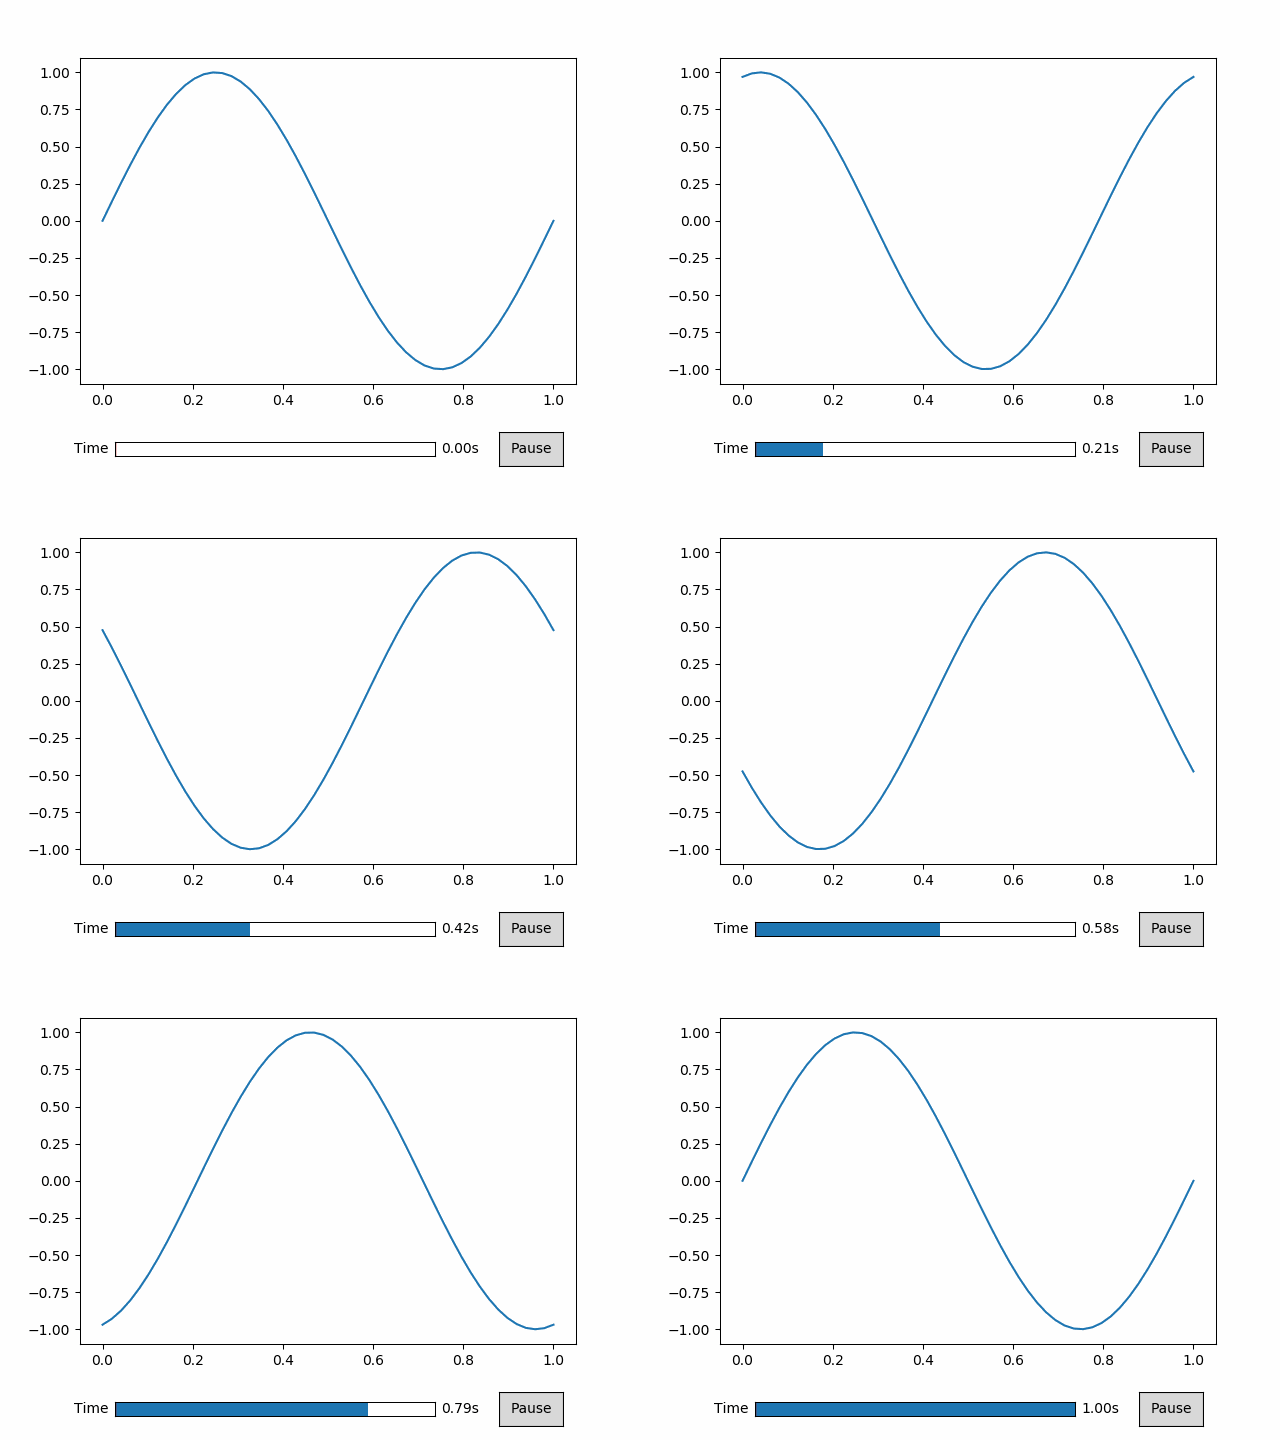
Simply passing in the values of time into the call to Animation doesn’t give us much control. Instead we use a Timeline.
[6]:
timeline = amp.Timeline(t, units='s', fps=20)
The units argument will set text to be displayed next to the time number.
The fps argument gives you control over how fast the animation will play.
[7]:
block = amp.blocks.Line(X, Y)
anim = amp.Animation([block], timeline) # pass in the timeline instead

anim.controls()
anim.save_gif('images/line4') # save animation for docs
plt.show()
Built on Matplotlib
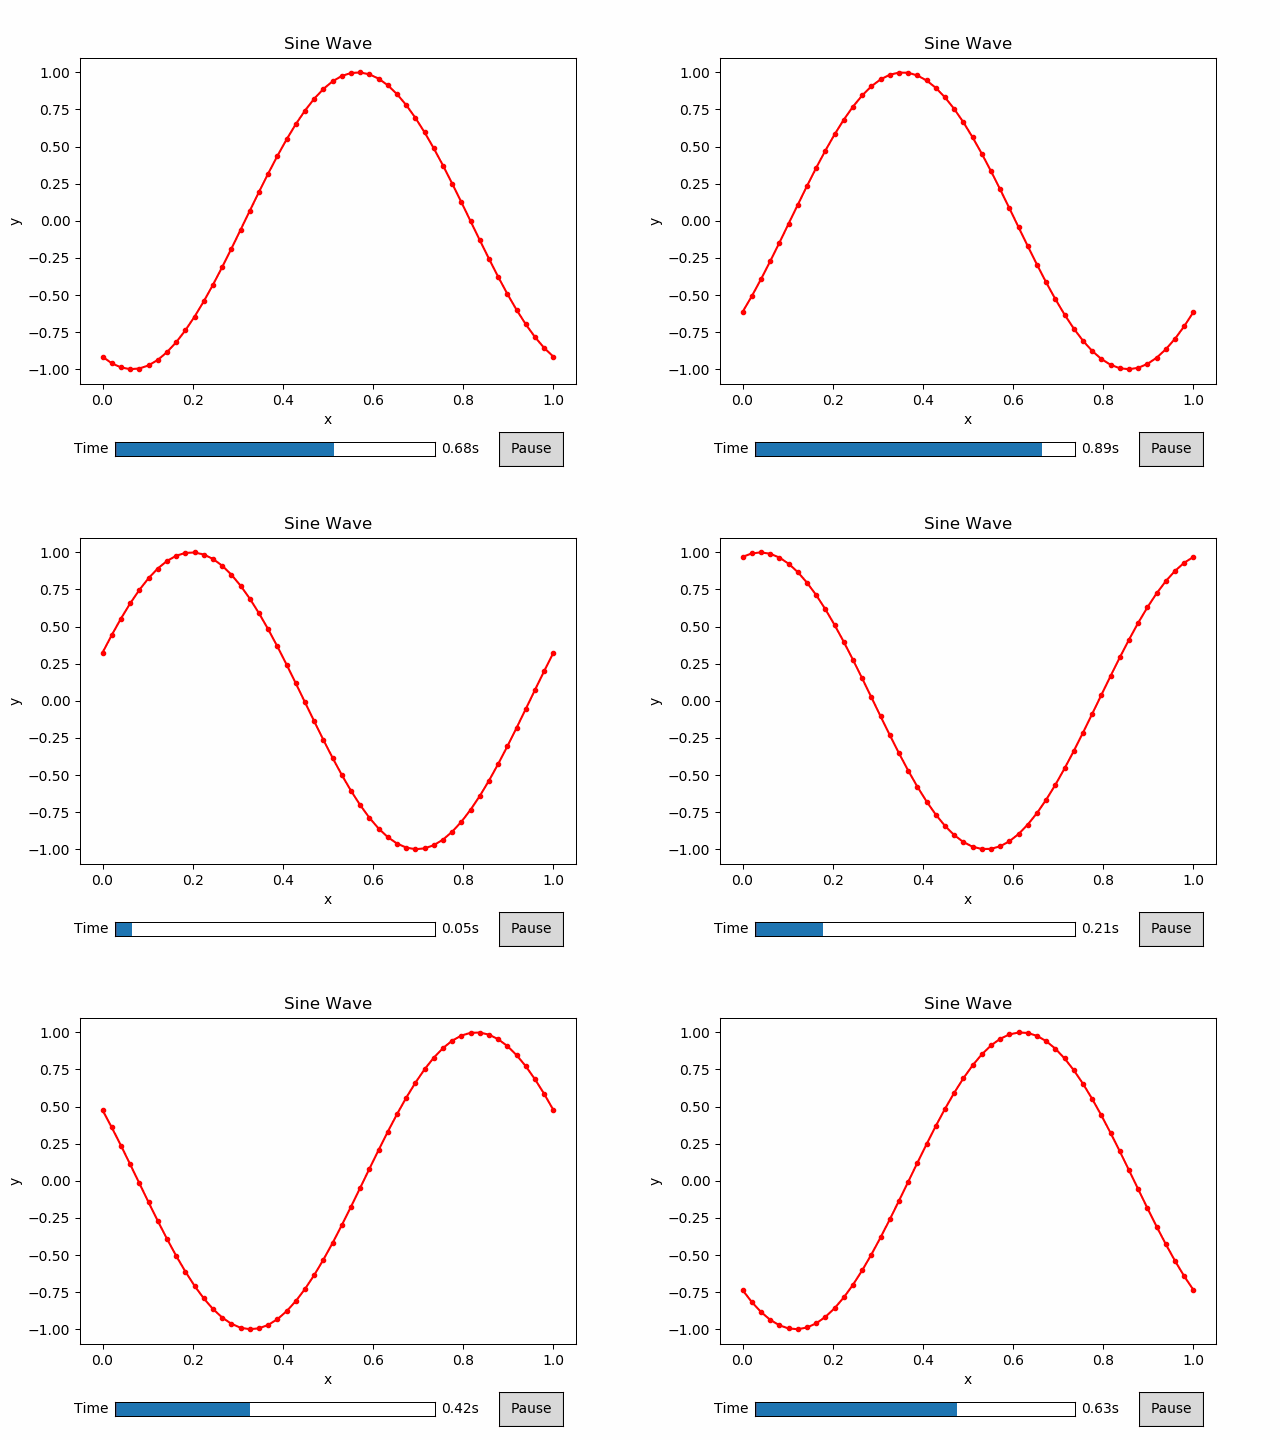
Since animatplot is build on matplotlib, we can use all of our matplotlib tools.
[8]:
block = amp.blocks.Line(X, Y, marker='.', linestyle='-', color='r')
anim = amp.Animation([block], timeline)

# standard matplotlib stuff
plt.title('Sine Wave')
plt.xlabel('x')
plt.ylabel('y')

anim.controls()
anim.save_gif('images/line5') # save animation for docs
plt.show()
