Imshow
[1]:
%matplotlib notebook
import numpy as np
import matplotlib.pyplot as plt
import animatplot as amp
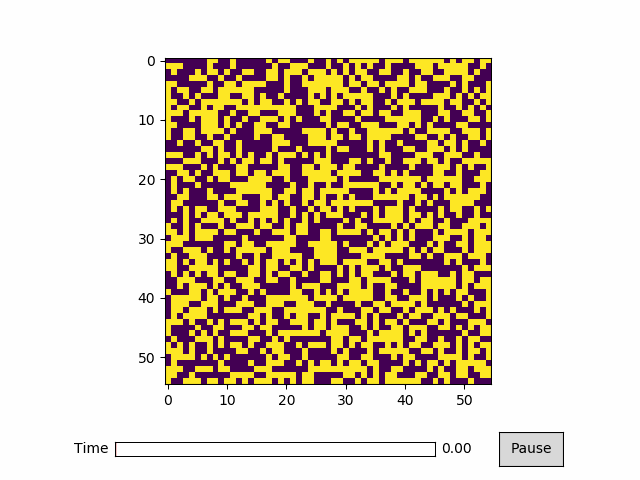
First we focus on creating the data. An ising model is used to make this data.
[2]:
# Define LxL matrix
L = 55
# Initialize as random spin
M = 2*(np.random.rand(L,L)>.5)-1
J = 1
b = 2.5

nPer = 100

images = [M]
for i in range(100):
    M = M.copy()
    for dm in range(nPer):
        jj = int(np.random.rand()*L - 1)
        kk = int(np.random.rand()*L - 1)
        dE = 2*J*(M[jj+1,kk] + M[jj-1,kk] + M[jj,kk+1] + M[jj,kk-1])*M[jj,kk]
        if dE <= 0:
            M[jj,kk]*=-1
        else:
            if(np.random.rand()<np.exp(-b*dE)):
                M[jj,kk]*=-1
    images.append(M)
    M[:,-1] = M[:,0]
    M[-1,:] = M[0,:]
Now we plot it.
[3]:
block = amp.blocks.Imshow(images)
anim = amp.Animation([block])

anim.controls()
anim.save_gif('ising')
plt.show()